
Photo Credit: Nick Onken
This post examines the indirect effect of the 2018-2019 school year’s Teacher Support programming on student literacy by analyzing using student test data from 584 Grade 1 and Grade 3 students in primary schools built by Pencils of Promise throughout the Eastern, Oti, and Volta regions in Ghana.
Ghana’s 2018-2019 Teacher Support (TS) program supported 652 teachers across 78 schools. During the 2018-2019 school year, TS programming benefitted 16,295 students in Ghana. The program includes group Teacher Workshops, individualized Coaching Sessions, and Material Delivery. While we iterate on programming each year, these components are crucial to our definition of quality programming, and more details are available here.
Photo Credit: Timmy Shivers
Design & Analysis
PoP Learning & Evaluation (L&E) teams work hard and dedicate significant resources to collecting and codifying high quality information, all in the service of better evidence-based decisions. In a mixed methods approach, both quantitative and qualitative data have their strengths and weaknesses. In the case of the EGRA, we use quantitative information on student literacy tasks as one star in the constellation of our efforts.
A careful study design ensures the information we collect speaks with fidelity to the sociocultural and educational realities we seek to describe. The analysis here complements this design. From the schools we visit to the students who are tested, we seek to design our work from a combination of the best available social science and the most feasible and collaborative approaches based on each country’s culture and PoP resources. In Ghana, we collect EGRA data in students who are in schools that receive TS, as well as in schools that do not receive TS. Along with other design features, this promotes stronger and more useful inferences — we can consider changes in TS schools relative to non-TS schools, so we shine a light on real differences our Programs teams work so hard to create.
PoP Ghana uses the (EGRA) as a basis for its assessment — students sit with a friendly PoP Staff member or enumerator and are evaluated on increasingly difficult literacy skills like reading and writing letters, words, and sentences.
PoP tested a cohort of 691 students with the EGRA tool in October 2018, and 584 students of the same students in June and July 2019 for this Endline analysis, across 15 TS schools and 5 non-TS schools. Student attrition data was collected and is primarily due to chance school absence and to families moving. Basic demographics of students are as follows:
- 298 students (51.03%) are male, and 286 students (48.97%) are female.
- Most students (75%) in Grade 1 and Grade 3 are between five and eight years old, with six and seven the most common.
- A vast majority of students Mother Tongue is Ewe (91.61%), with Guan, Kotokoli, Twi, and other languages constituting between 0.5% and 3%.
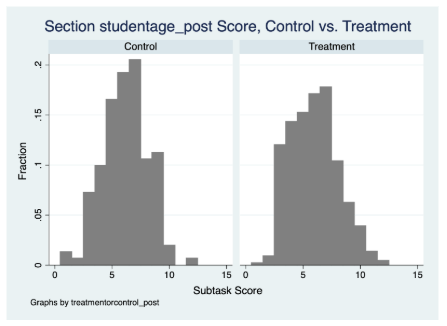
Figure 1: Student age 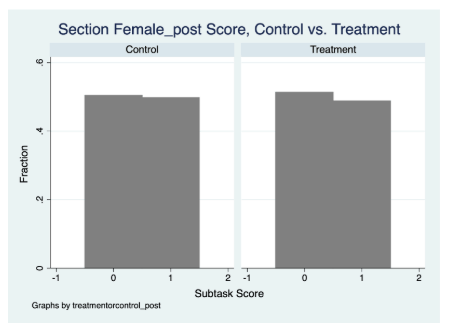
Figure 2: Student sex (1 = female)
Results & Learnings

Photo Credit: Timothy Shivers
Students in both groups (TS and non-TS) are learning literacy skills as measured by the EGRA, and TS programming predicts higher student performance on the EGRA above and beyond non-TS student gains (as analyzed with multiple linear regression).
Participation in TS is a significant predictor of increased student literacy performance for five EGRA sections. Importantly, the positive relationship between TS and student scores is seen even when attempting a causal adjustment for a variety of structural factors that otherwise may artificially bias this relationship (called confounders); multiple regression analysis allows us to parse the relationship of TS to student scores specifically by adjusting for the other variables in the model. This analysis thereby is also able to examine the independent contributions of each and every other factor in the model.
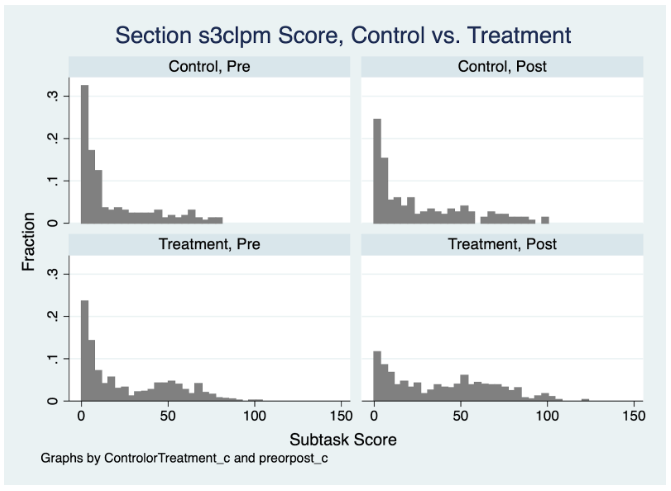
The illustration below displays what student scores look like for a section on the EGRA, to get a sense of what the regression highlights. Figure 3 is for Section 3 on the EGRA, where students are asked to name 100 letters aloud. They’re timed, as the rate at which students do this is valuable, too. We see the distribution of student scores in non-TS schools across the top row, and in TS schools across the bottom row; Baseline testing is on the left, and Endline on the right. We can see the number of students scoring at zero drop dramatically over time, particularly for the TS group. We can also see scores overall shift to the right, clustering between about 35 and 75 correct letters per minute. Regression results highlight the importance of TS versus non-TS in this positive movement.
Regression analysis also speaks to other factors that are important to PoP L&E efforts and the organization’s mission. Results suggest gender equity, in that gender has no significant nor consistent relationship with student scores. Average scores for boys and girls are about the same in each section at Baseline and at Endline, with girls scoring marginally higher in some sections.
Additionally, another major positive finding in this analysis is that students in Grade 3 are predicted to achieve a higher score than students in Grade 1 on 9 of 10 sections, as hypothesized. These older students who have had more schooling are performing better. These results are reassuring, and worth pausing on.

Photo Credit: Chi-Chi Ari
Interestingly, analysis also finds that students who are able to name the last book they have read are predicted to achieve significantly higher scores; this is a highly consistent and significant pattern of student behavior. Other behavioral factors, like reading outside of school and reading with others both (separately) predict higher scores in two separate EGRA sections each, but are not near the consistency which naming the last book provides in predicting a higher score (9 of 10 sections).
One interpretation is that naming a specific book title could be evidence of high motivation to read, in that a student could remember the name of a book because they like it — whereas simply “Yes” to a question about reading outside of school isn’t as strong evidence of motivation or reading behavior.
Photo Credit: Nick Onken
Of course, these results must be considered with all the available evidence, such as teacher interviews, classroom observations, and other forms of assessment that L&E collects. That said, these results are formidable and encouraging. It’s promising that PoP can look forward to several more years of TS programming and L&E efforts as we continue to follow this cohort of students in their journey.
With a longitudinal design, we set our analysis up to align with the reality of education everywhere: students work hard to learn to read and write over multiple years, since education doesn’t happen overnight. We believe students in PoP schools are set up for success with high quality programming, and over the coming years, we will follow the patterns trends as students continue to learn the skills they need to thrive. As you can see in these results, students are learning. We’re looking forward for more to come.