

About the Teacher Support Program: What Do We Do?
Pencils of Promise (PoP) builds out our literacy programs with Ghanaian communities who believe in education; we construct schools with communities and train government teachers via our Teacher Support programming to improve students’ reading, writing, and comprehension. Then, we use collected data to create genuine insight and honest learnings that help us improve the effectiveness of our programming on student learning through examining data representing about 10,800 students impacted last year using a careful data pipeline.
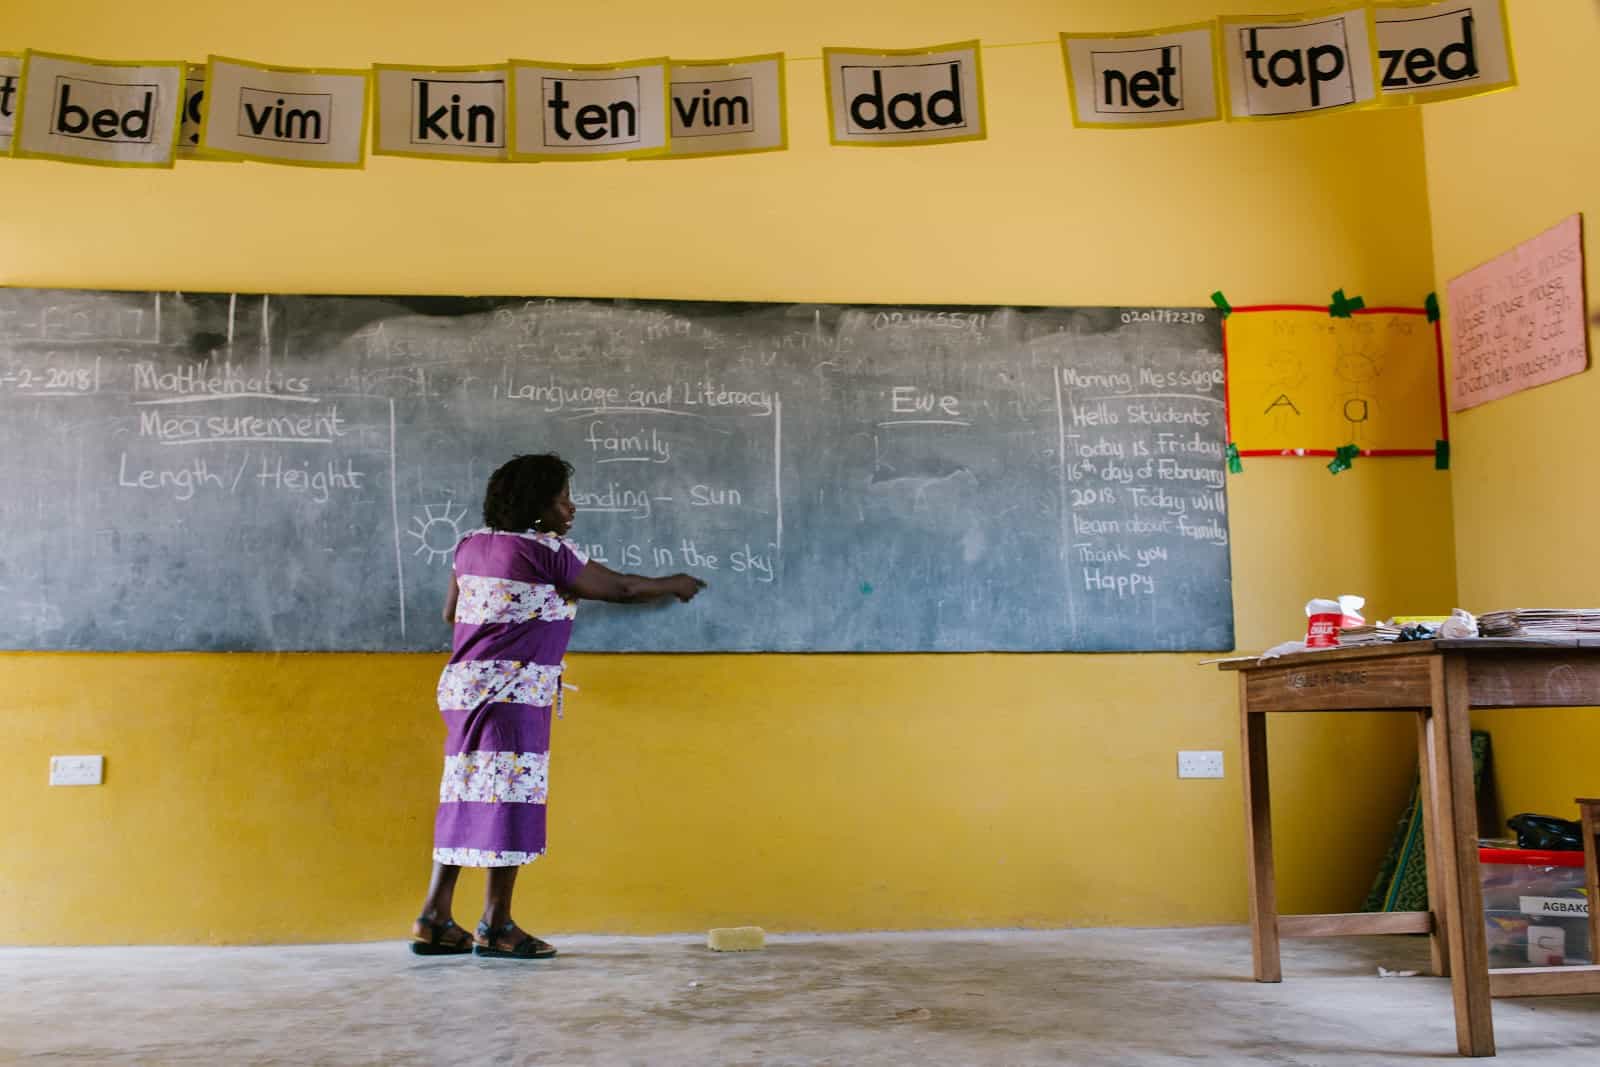
Our 2017–2018 Teacher Support (TS) program in Ghana supported English teachers across 48 schools, about a third of our total 148 PoP builds in the country. We use an Early Grade Reading Assessment-based test (EGRA) to evaluate the impact of our program on student literacy hypothesizing that TS-supported teachers (Treatment group) would demonstrate greater improvements in student test scores when compared to non-TS teachers (Control group).
PoP’s Teacher Support program in Ghana includes:
- Group teacher workshops: workshops are held at the beginning of each of three academic terms. We train teachers on PoP methods and pedagogy and demonstrate a series of strategies that can be used in lessons.
- Individualized coaching sessions: after modeling, co–teaching or observing a teacher’s lesson, PoP TS staff meet teachers one–on–one twice per month to provide individualized feedback which aims to build teacher capacity, leading to improved teaching techniques and more engaging classrooms.
- Community meetings: PoP joins PTA meetings at least once per year, typically at the beginning of the academic calendar. The goal of these meetings is to increase ante from parent leaders in the community, ensure they are aware of the services being offered at their school and include them in the current challenges and successes.
Design & Analysis
As the foundation sets up the building, the research design sets up possible inferences. We don’t consider the changes in PoP schools, but rather we consider the changes in PoP schools receiving TS (Treatment) as compared with changes in PoP schools not receiving TS (Control). This enables us to examine the effectiveness of our work above and beyond the gains which students make outside of TS programming.
With this design, we see specifically how variables are useful in predicting and explaining an outcome like Endline scores, as modeled by a forward step-wise built multiple linear regression. How much does X affect Y? How much do A, B, and C affect Y? How about, how much does X affect Y when we isolate it from the influence of A, B and C? Okay, now to apply this: how much does Treatment affect EGRA Endline scores? How much does Treatment affect EGRA scores when isolating out the influence of Baseline scores, Gender and Mother Tongue? This is the model used (with additional variables useful for us to know about and adapt on, like the grade of the student).
Formalizing the mathematical model here allows us to get specific on what we can truly measure and interpret, to move forward on a strong foundation of truth. PoP tested a two-stage cluster randomized sample averaging 5 to 8 students per class across Grades 1–6 in 21 Treatment and 15 Control schools. This gives the total of 1,386 students across 36 total schools that participated in both Baseline and Endline tests. By examining results from students this way (and correcting for clustering effects at the school level), we can measure the amount of variation in the outcome explained by each predictor and thus quantify the strength of these relationships, like in the X’s and Y’s example above.
The Treatment group in this analysis is randomized from schools that meet inclusion criteria and that receiving this programming, as is the Control group. These samples are considered by Ghanaian team members and statistical analyses to be matched to Treatment schools on variables relevant to the student and teacher capacity, as well as sociopolitical context; they are differentiated in that they do not receive PoP programming.

Results & Learnings
Using data analytics for program evaluation and adaptation is a bit like flying a plane in a storm: you can’t literally see what’s happening, so you have this panel of instruments informing you about what’s up. A compass for where you’re headed, altimeter for altitude, all that. We use the EGRA in this analysis, and integrate information from our other metrics (like teacher interviews) when we iterate.
There’s a lot to parse through here; PoP programming in Ghana is some of our most extensive, with 1,386 student tests representative of about 6,360 students.
So where are we headed? With this specific metric, we find mixed results among the 1,386 students. Each EGRA subsections’ scores in the Treatment group are largely consistent, or improve marginally, but are not statistically above and beyond the gains found in Control groups.
This is to say, the regression results do not support the hypothesis that PoP programming significantly improves student test scores above non-TS school gains (when controlling for the influence of demographic and structural factors).
Evidence suggests that where students are at the start of the year predicts where they are at the end. For example, a students’ Baseline score is consistently useful in predicting their Endline score. This is the case across Treatment and Control, and across different grades. Additionally, for more complex literacy tasks, a student scoring zero on a subsection at Baseline predicts lower scores at Endline.
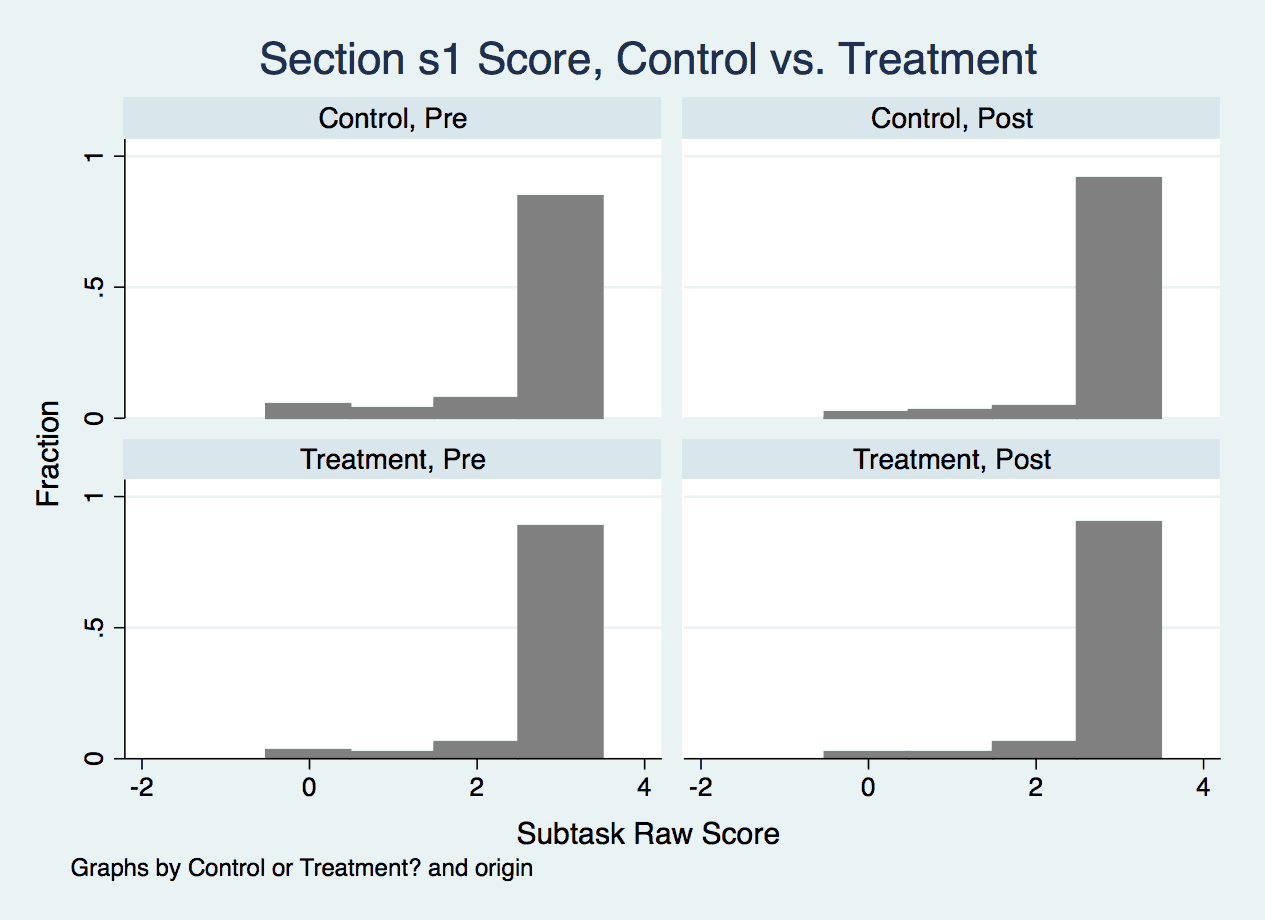
One illustration of the influence of Baseline scores is from Section 1 (Orientation to Print) (Figure 1); scores at Baseline were high for both groups, so the regression results have a hard time demonstrating our program’s efficacy above and beyond Control schools. This is a comforting interpretation made possible by our design.
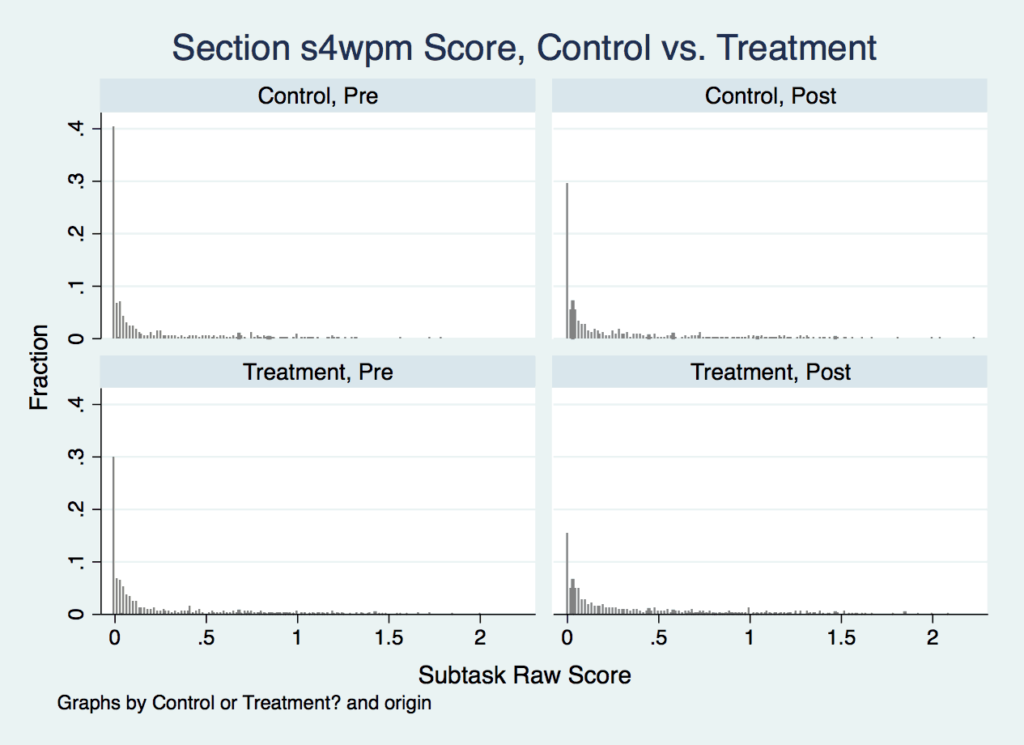
Another example of this is Section 4 (Familiar Words Identified Correctly Per Minute) (Figure 2), where you can see the Control group and Treatment group start from similar places at Pre-test, and while the number of zero scores drops visibly particularly in the Treatment group, they are similar enough at Post-test where analysis fails to find significant differences.
Familiar Word Identification is of course pretty hard for young kids, particularly when education resources are historically low. So, it makes sense to look at this more carefully and parse out more specific conclusions. We can take a look at this same Section 4 data visualized in our public Tableau (rather than in Stata during analysis). First, Figure 3 shows average Section 4 (Familiar Words Identified Correctly Per Minute) scores: the top row has each grade’s Control and Treatment scores at Baseline and then Endline, then the same for Treatment, then proceeds to the next grade. Figure 4 shows this same information for the next 3 grade levels.
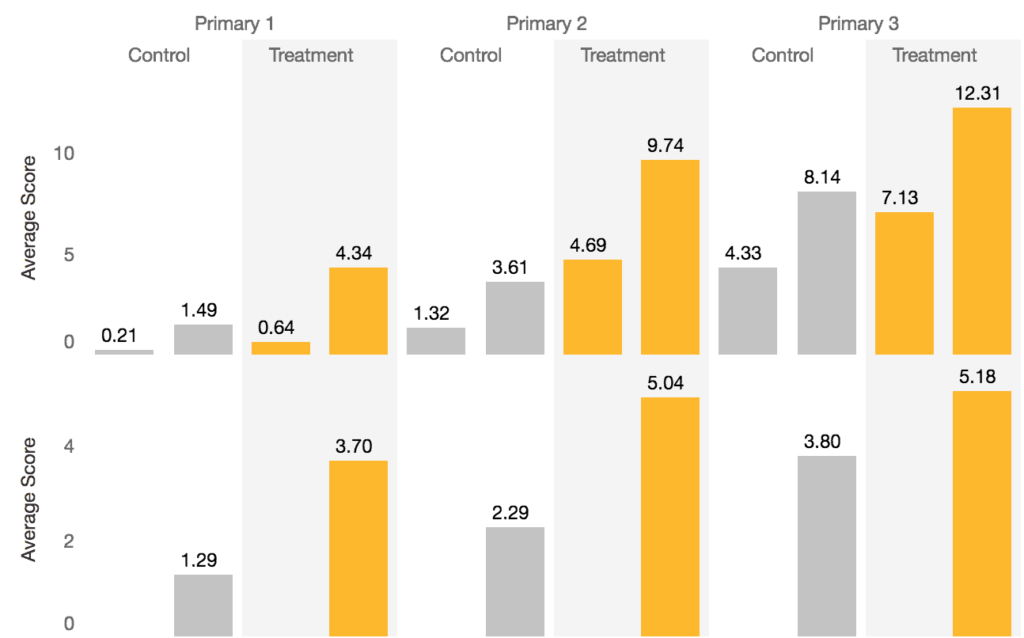
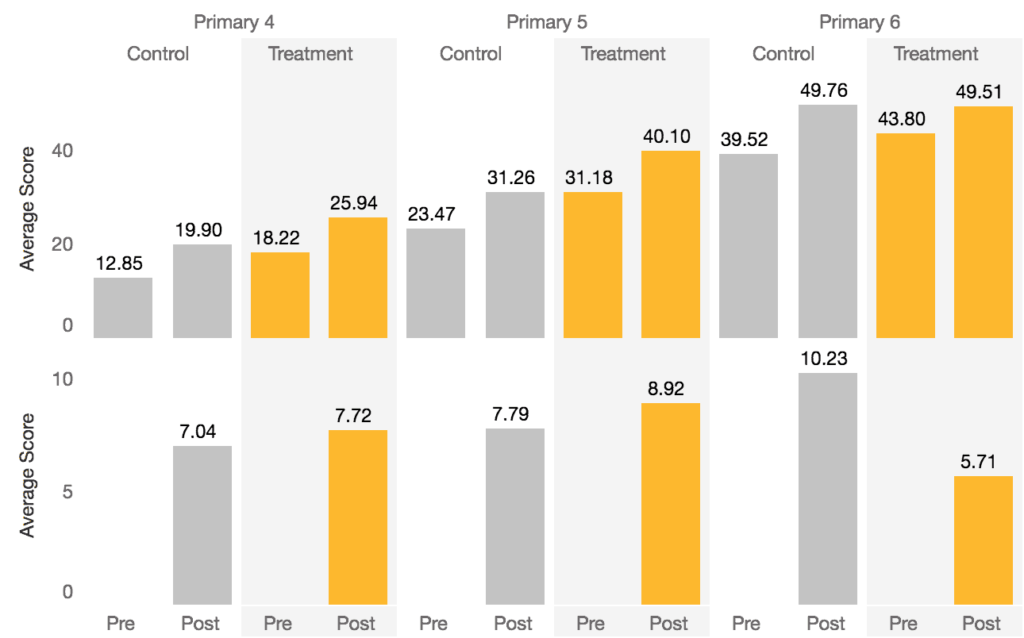
There’s a learning for us here: Later grades do better overall and seem to improve more. We also see this in other EGRA sections as well. We can see this pattern here, and in the regression results, that higher grades seem to absorb more and perform better; perhaps this suggests students are more able to absorb their lessons. This makes some sense given that the students are older and have more exposure to English lessons and content. However, this improvement is not substantial enough to deem programming effective above and beyond the influence of grade level.
To create a deeper sense of what these Endline analyses help us with (and for fun), consider briefly about what these results might look like when considering more variables. For example: enumerators adapt to student needs and opt to give instructions in English, Ewe or a mix of the two when administering the EGRA. Interestingly, there are effects of the main test language on EGRA scores: tests done in Ewe significantly predict a lower score across many subsections, but tests in English significantly predict a higher score. This makes sense: students who are most comfortable receiving EGRA instructions in Ewe may prefer Ewe overall or are uncomfortable with English, and this discomfort is reflected in their English literacy capacity. Additionally, gender does not predict higher or lower EGRA scores for our students. This is to say, our program is equitable across genders. Were this not the case, we’d have to think hard about what’s influencing this and what it interacts with, and what to do about it.
How are our results best utilized? What do we anticipate? First and foremost, I believe our culture of rigor and fidelity to the truth gives our challenges and successes a real gravity. We continue to work hard at perfecting our programming, and we move forward by focusing our conversations carefully on the complex reality of education and program evaluation in rural areas of Ghana’s Volta region. We work to investigate more nuances in how we can help teachers to help their students, by continuing to listen to the insights of our Ghanaian team and combine these with more granular analyses of EGRA results with other metrics (teacher interviews, teacher observations, coaching logs and more). We’re talking already about data integration and a thorough understanding of each step of our logic model.
An interesting challenge is that we construct schools and support teachers, who in turn supports their students, and we collect EGRA data from the students. This multilevel, indirect process makes causal inferences difficult, especially when education changes are long-term and incremental. We’re continuously improving our design and analysis with a particular emphasis on making strong inferences that inform our programming: next on this is moving toward a longitudinal design that allows us more specific information on pathways of influence. More on this soon.