Photo Credit: Lauren Nicole Smith
About the Teacher Support Program: What Do We Do?
This analysis examines the impact of the 2018-2019 school year’s Teacher Support programming on student literacy, using student literacy test data from 1,060 Grade 3 and Grade 4 students in primary schools built by Pencils of Promise throughout Luang Prabang province in Laos.
Pencils of Promise (PoP) implements Teacher Support (TS) programming in Lao communities who are committed to education. First, we partner with communities to conduct a rigorous Needs Assessment and gauge the interest and engagement of local teachers, parents, and leaders; then, we build sustainable public schools for public school teachers, with up to 20% of either labor or materials being provided by the community. In many of these schools, we provide TS programming to teachers, with the ultimate goal of improving and supporting students’ efforts to learn reading, writing and comprehension skills.
Laos’ 2018-2019 TS program supported 107 teachers across 60 schools (shout-out to the Laos Programs team!). This past school year, TS programming benefitted 1,974 students. Key components of PoP’s TS program include:
- Group teacher workshops. The first workshop is five days long, at six hours per day for a total of 30 hours of education per teacher. The second workshop is three days at six hours apiece, for 18 hours. The goal of these workshops is to facilitate and integrate pedagogical methods into everyday classroom instruction for the curriculum provided by the Laos Ministry of Education.
- Individualized coaching sessions. TS staff provide teachers one–on–one coaching once every month for about six to seven sessions per school year. After modeling, co–teaching, or observing a teacher’s lesson for about 45 minutes, PoP staff spend 45 minutes of individualized feedback with the teacher, critical for improving the implementation of new methodologies and materials. Afternoon class observations and feedback sessions are shorter. These sessions aim to build teacher capacity, leading to improved teaching techniques and more engaging classrooms.
- Material Delivery. Schools in the program receive tools to facilitate teacher instruction and student engagement, including: a projector, notebooks, student flashcards, teacher flashcards, alphabet flashcards, solar panel and connector kit, speaker, and USB flash drive.
Photo Credit: Lauren Nicole Smith
Design & Analysis
Just like a good concrete foundation sets up a strong building, a research design sets up a mathematical inference. Since we measure both TS and non-TS schools over time, we can consider the changes in student scores from TS schools above and beyond the changes in non-TS schools. This enables us to examine the effectiveness of our work with reference to what may have occurred in its absence.
PoP Laos uses the Annual Status of Education Report (ASER, and impact in Hindustani), a tool developed to measure the skills necessary for acquiring literacy. It was originally developed to “provide a snapshot of children’s schooling and learning for a representative sample of children across rural India”. PoP has conducted extensive development and leveling to tune the tool for appropriate usage with the students in Laos schools, and there is a separate test version for third graders and for fourth graders.
In this case, we compare the improvement of third grade student scores in TS schools versus non-TS schools using a sample of 538 third graders. We also separately compare the improvement of fourth grade student scores in TS versus non-TS schools via 522 Grade 4 students.
Each of these 1,060 students across the 45 sampled schools are measured at the beginning (“Baseline”) and end (“Endline”) of the school year in Laos for a total of 2,120 ASER tests. Basic demographics are as follows:
- 532 students (50.18%) are male, and 529 students (55.94%) are female.
- 593 students (55.94%) are ethnically Khmu, 324 students are Hmong (30.57%), and 144 (13.59%) are Lao Loum.

Photo Credit: Timmy Shivers
Results & Learnings
There are two main discoveries: 1) Teacher Support programming predicts higher student performance on the ASER above and beyond non-TS programming student gains, for three of four subsections (in both third and fourth grades) and 2) zero scores drop significantly more in TS schools versus non-TS schools for some subsections across the two grades.
Importantly, results for both Grade 3 and Grade 4 students also suggest gender equity in outcomes, in that gender is not a significant predictor of improvement or decline in any ASER section scores for either grade. Average scores for boys and girls are about the same in each section at Baseline and at Endline.
All students appear to be learning, and higher scores are associated with Teacher Support programming for both third and fourth grade students (separately). Evidence suggests student performance in PoP-built public schools enrolled in the 2018-2019 TS program show a significant improvement of student test scores above and beyond gains shown in PoP-built public schools not receiving TS programming in three of the four sections of the ASER.
For third graders, we see this in the Images, Uppercase Letters, and Lowercase Letters sections of the ASER (and not in the Words section). Neither the TS nor non-TS group shows much improvement in the Words section amongst third graders. Additionally, there is evidence of a significantly greater drop of students scoring at zero for TS students compared with non-TS students in the Images section of the test; this could imply that students who score zero at Baseline are not being left behind in favor of improving others’ scores.
For fourth graders, we see this significantly greater improvement in the Images, Uppercase Letters, and Words sections (and interestingly not the Lowercase Letters section). Evidence also suggests that students in TS schools also show a significantly larger decrease in zero scores compared with decreases in non-TS schools, for the Uppercase Letters, Lowercase Letters, and Words sections. This also implies that students are not being left behind in these topics.
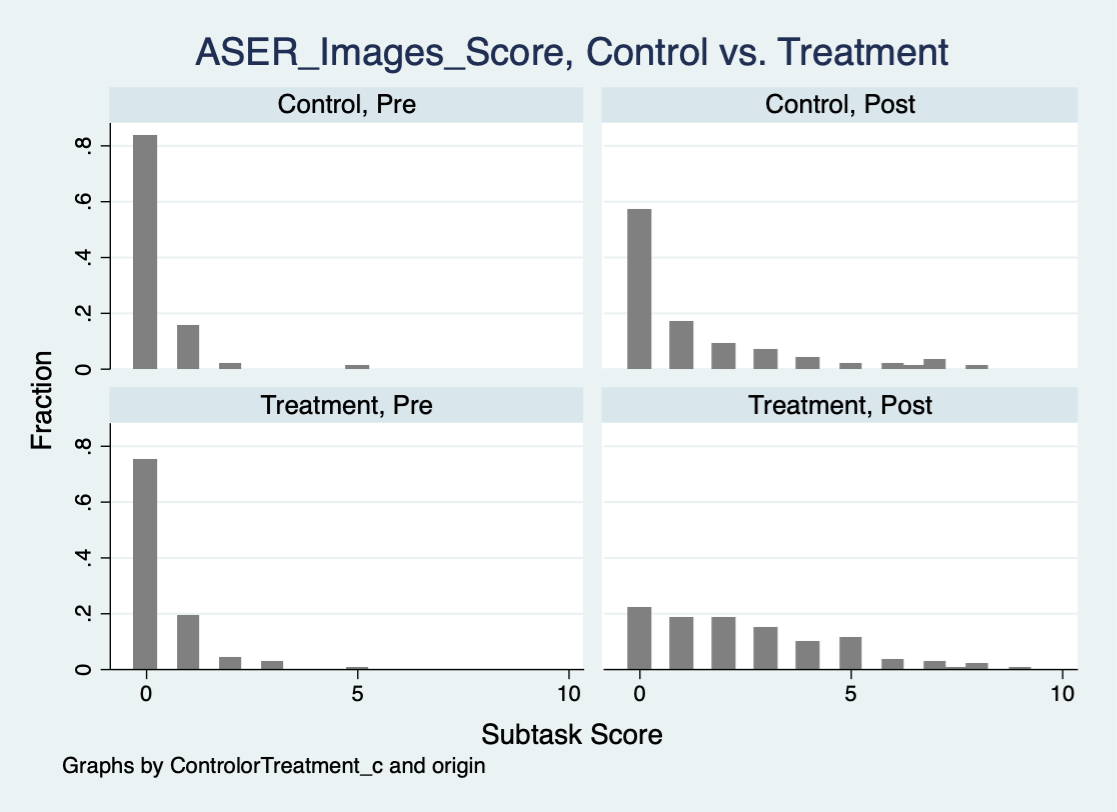
We’re able to see both of these types of results in the figure below, which depicts the results on third graders’ Images section. We can see the drop in the percent of students scoring at zero by looking at the leftmost bars in each chart. By reading across the top row, we can see the drop in these zero scores from Baseline to Endline in the non-TS group, from 82% of students scoring at zero to about 56%. On the bottom row, we can see in the TS group that 75% of students score zero at Baseline and this drops to 22% at Endline; this is a statistically significant difference. We can also see TS predicting significant improvement beyond non-TS, seeing in the bottom row that the distribution of scores shift to the right more than the non-TS schools in the top row.
Figure 1: Grade 3 TS vs. non-TS on “Image” section
Another type of result is illustrated below. Grade 3 students do not show significant differences between TS and non-TS schools at Baseline, but Grade 4 students do. We can see that there is a large difference in the left charts in the top row and the bottom row before the school year begins; statistical testing confirms this.
Figure 2: Grade 4 TS vs. non-TS on “Uppercase Letters” section
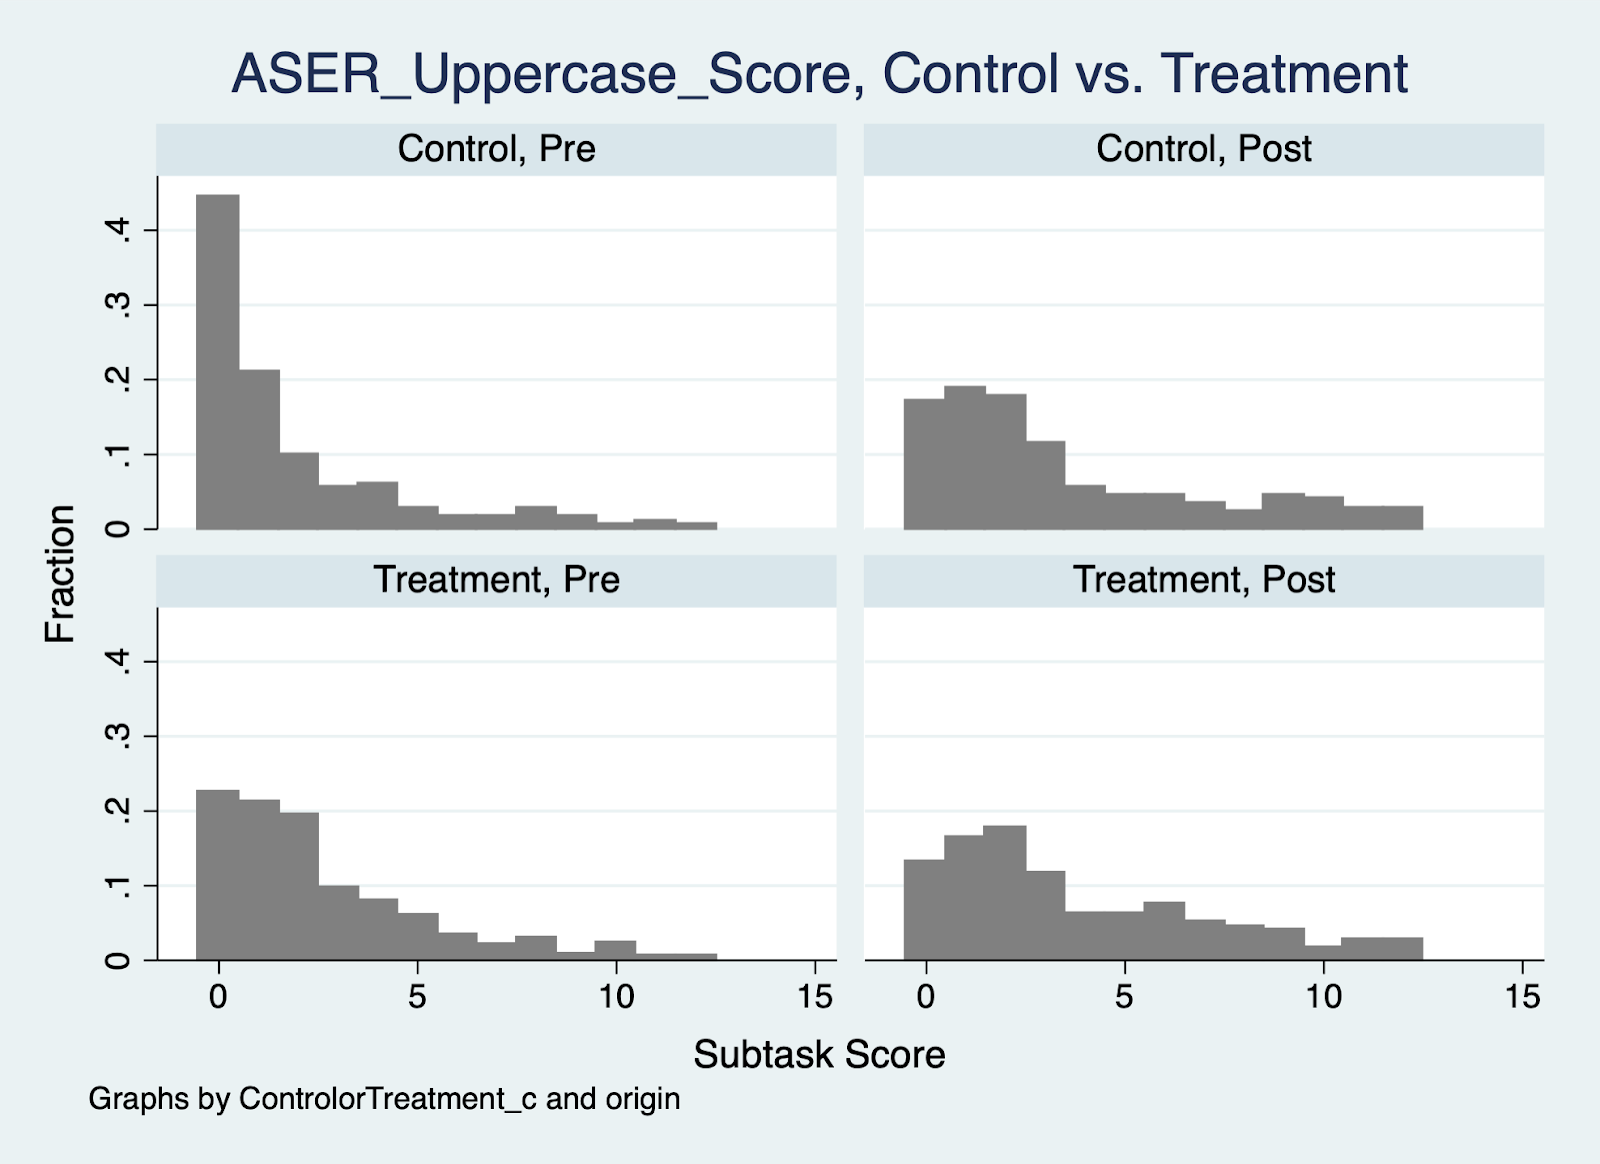
Grade 4 students in TS schools are performing higher than non-TS students at the beginning of the school year. Our interpretation of this is that Grade 4 students have already had one year of PoP’s TS programming, during third grade, and this constitutes additional learning that may be staying with them (PoP Laos programming doesn’t start until third grade because English isn’t taught in the curriculum until then).
The most exciting component of this is that because of our recent shift to a longitudinal design, next year (and the year after) we’ll be able to see these same students’ performance change over time as they spend more time in schools with TS programming.

Photo Credit: Timothy Shivers
Learning takes tremendous effort, and education takes quality time. We’re setting our students up for success with carefully designed and rigorous programming on top of the carefully designed national curriculums, and now PoP is aligning our evaluation efforts to peer into and work with the real-world messiness and complexity that is student literacy. Over the years to come, we will be able to follow patterns and trends as the students in our schools work hard to learn what can be a second, third, or even fourth language. As you can see in these results, it’s working. And we’re excited for what’s to come.
